Table of Contents
Overview – ECG Physiology
ECG physiology refers to the electrical events in the heart that are captured by an electrocardiogram (ECG), a critical tool for assessing cardiac rhythm, conduction, and potential pathologies. An ECG records the cumulative action potentials from nodal and myocardial cells. Understanding how ECG waveforms relate to cardiac conduction, contraction timing, and axis orientation is essential for accurate diagnosis and clinical decision-making.
What Is an ECG?
- An ECG is a recording of all action potentials generated by the heart’s nodal and contractile cells at a given time
- It is not a recording of a single action potential
- Electrodes record voltage differences using voltmeters
- A lead refers to an imaginary line formed by a combination of electrodes
- A standard 12-lead ECG uses only 10 electrodes
Types of Leads
- 3 Bipolar Leads: Measure voltage between limbs
- I = LA(+) – RA(−)
- II = LL(+) – RA(−)
- III = LL(+) – LA(−)
- 9 Unipolar Leads: Offer a 3D electrical view of the heart
ECG Output
- X-axis: Time
- Y-axis: Amplitude (voltage) – reflects number & size of depolarising cells
Understanding ECG Waveforms
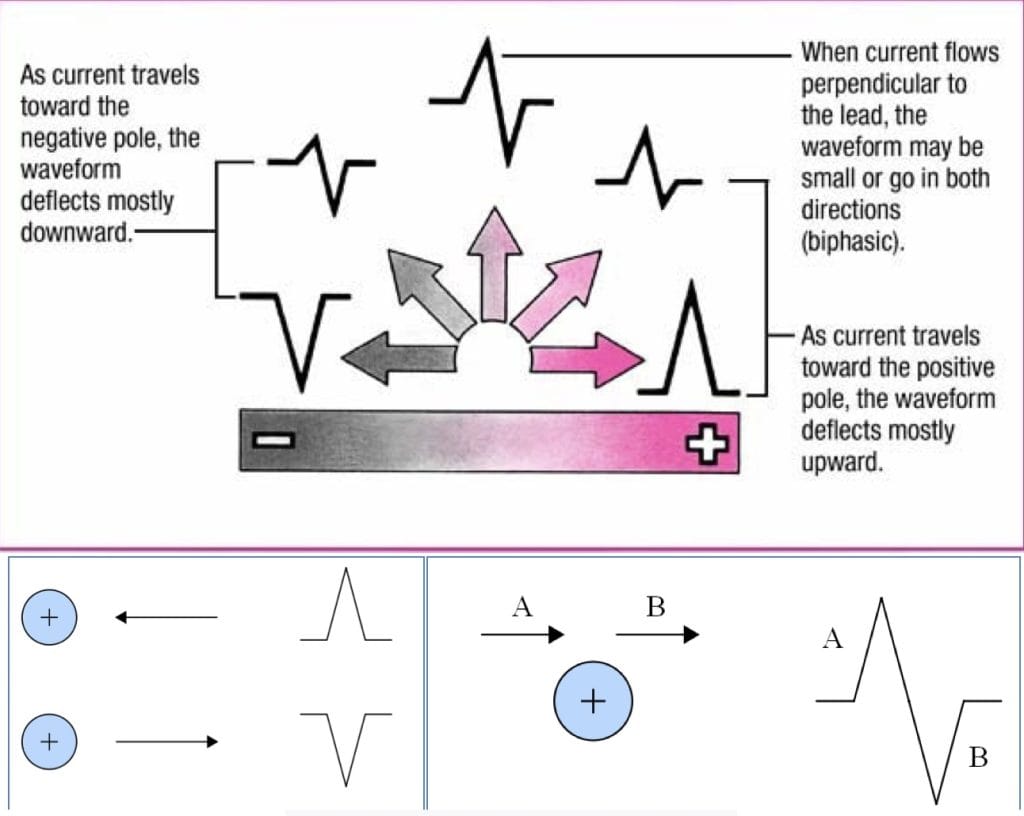
- Depolarisation toward a + electrode = positive deflection
- Depolarisation away from a + electrode = negative deflection
- Depolarisation perpendicular to a lead = biphasic (positive then negative) deflection
How Each Wave & Segment Is Formed
| Wave/Segment | Image |
|---|---|
| P – Wave: Atrial depolarisation. Confirms SA node activation | 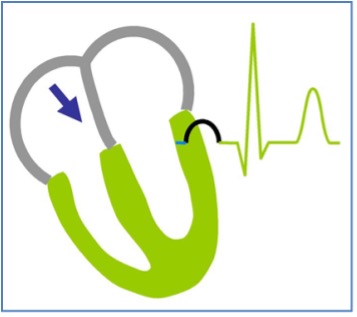 |
| PR-Segment: Delay between SA and AV nodes. Atrial contraction occurs during this segment. |  |
| Q – Wave: Depolarisation of the interventricular septum. Often small or absent; biphasic due to perpendicular direction. | 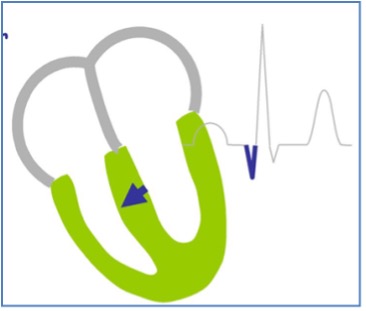 |
| R – Wave: Main ventricular depolarisation. Large amplitude due to high myocyte volume. Follows direction of the heart’s electrical axis. | 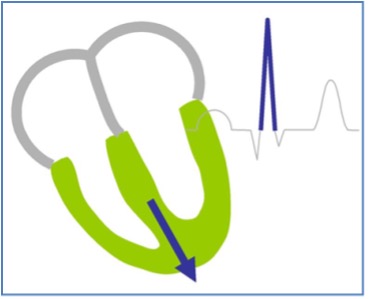 |
| S – Wave: Terminal depolarisation of ventricular walls via Purkinje fibres. Opposes the main electrical axis → small negative deflection. |  |
| ST – Segment: Ventricular contraction phase (mechanical event following electrical depolarisation) |  |
| T – Wave: Ventricular repolarisation Positive deflection because repolarisation occurs in the opposite direction to depolarisation | 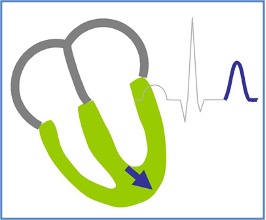 |
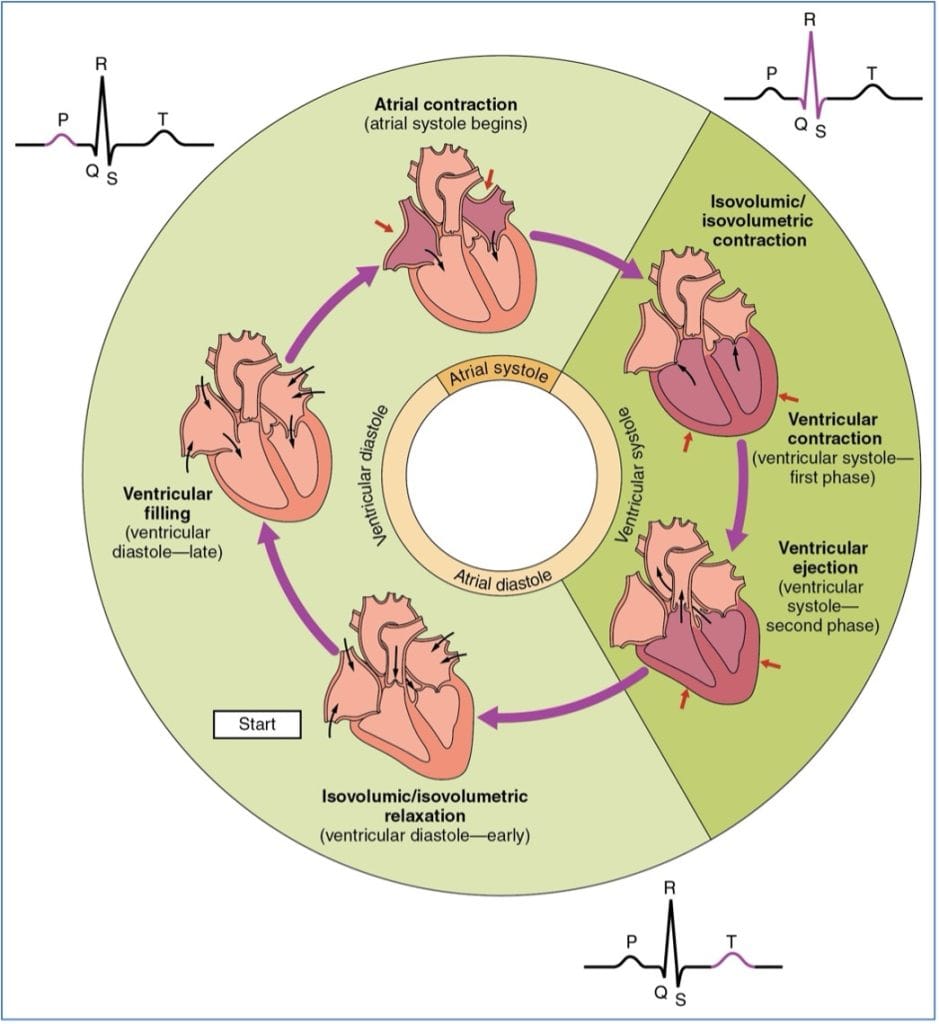
Relating ECG to the Cardiac Cycle
- Electrical signals precede mechanical contractions
- Blood flows from high to low pressure
- Coordinated electrical timing ensures valves open/close properly for unidirectional blood flow

Electrical Axis of the Heart
- Refers to the overall direction of ventricular depolarisation in the frontal plane
- Typically runs right shoulder to left leg
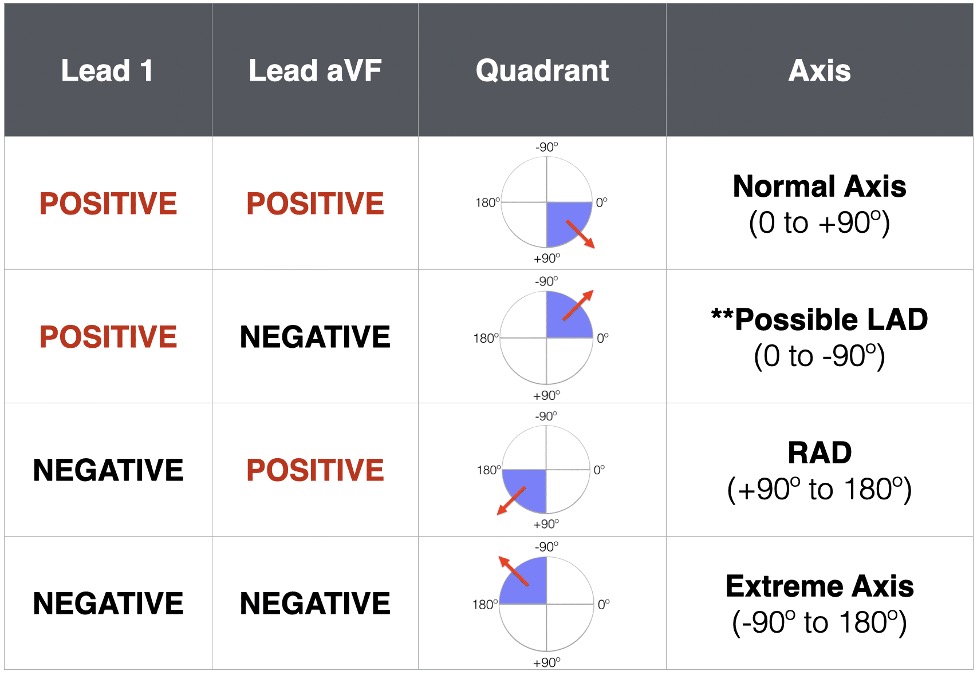
Quadrant Method for Axis Determination
- Look at leads I and aVF:
- Normal axis: QRS positive in I and aVF (30°–105°)
- Left axis deviation (LAD): QRS positive in I, negative in aVF (−30° to −90°)
- Right axis deviation (RAD): QRS negative in I, positive in aVF (+105° to +180°)
- Extreme axis: QRS negative in both I and aVF
Systematic ECG Interpretation
1. Confirm Patient Details & Calibration
- Speed: 25 mm/sec
- 1 large square = 0.2 sec
- 1 small square = 0.04 sec
2. Determine Heart Rate
- Count large squares between QRS complexes
- HR = 300 ÷ number of large squares
- 100 bpm = Tachycardia
- <60 bpm = Bradycardia
3. Assess Rhythm
- Is it sinus rhythm?
- P wave before each QRS?
- If not sinus:
- Is it regular, irregular, or irregularly irregular (e.g. atrial fibrillation)?
Atrial Fibrillation
- Irregularly irregular
- P waves replaced by chaotic baseline activity (~300/min)
4. PR Interval
- Long PR = 1st degree heart block
- Some P waves not followed by QRS = 2nd degree block
- No relation between P and QRS = complete heart block
5. QRS Complex
- Width should be <3 small squares
- Wide QRS:
- Suggests ventricular origin or bundle branch block (BBB)
- In tachycardia: likely ventricular tachycardia (VT)
- Hypotensive: Shock
- Normotensive: Consider IV drugs
6. T Waves
- Upright or inverted? Assess for signs of ischaemia or electrolyte imbalance
7. ST Segment
- Elevation = Infarction
- Depression = Ischaemia
- Correlate ST changes to regions of the heart:
- Inferior: II, III, aVF
- Lateral: I, aVL, V5, V6
- Anterior: V2–V6
Note: Normal ECG does not rule out infarction
If LBBB or pacing present, ST analysis is unreliable
Summary – ECG Physiology
ECG physiology helps interpret the heart’s electrical events and their correlation with mechanical contraction. By analysing ECG waveforms, segment timing, and axis deviation, clinicians can detect arrhythmias, blocks, and ischaemic changes. Mastery of ECG interpretation is a core skill in cardiovascular diagnostics. For a broader context, see our Cardiovascular Overview page.